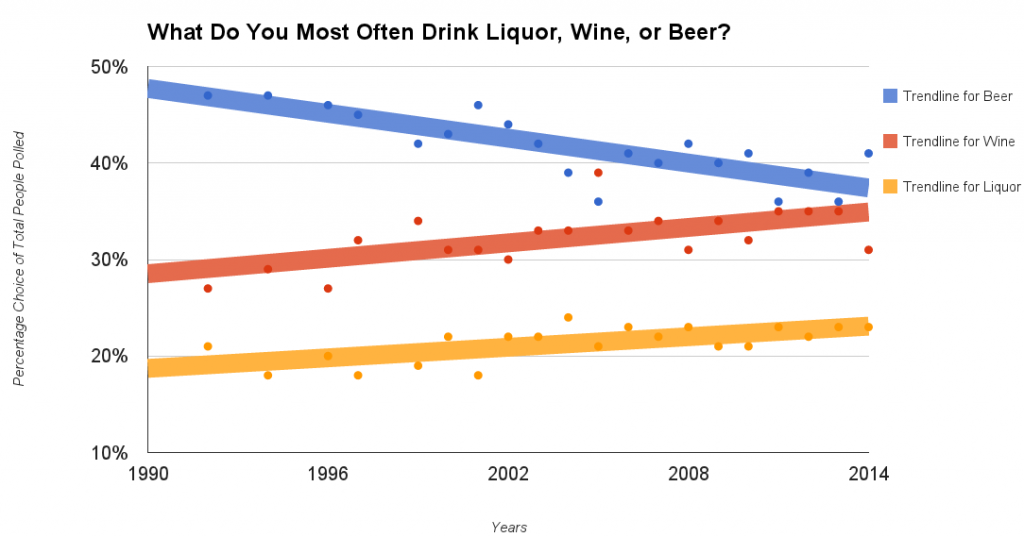
* Less than 0.5% Source: Gallup – Based on those who drink alcohol.
Polynomial trendline version of the chart (fluctuations in the data)
Just for fun, here is the Google Trend data for internet searches for each (look at wine surge every December).
Full Data Set:
| Year | Beer | Wine | Liquor |
| 1992 | 47% | 27% | 21% |
| 1994 | 47% | 29% | 18% |
| 1996 | 46% | 27% | 20% |
| 1997 | 45% | 32% | 18% |
| 1999 | 42% | 34% | 19% |
| 2000 | 43% | 31% | 22% |
| 2001 | 46% | 31% | 18% |
| 2002 | 44% | 30% | 22% |
| 2003 | 42% | 33% | 22% |
| 2004 | 39% | 33% | 24% |
| 2005 | 36% | 39% | 21% |
| 2006 | 41% | 33% | 23% |
| 2007 | 40% | 34% | 22% |
| 2008 | 42% | 31% | 23% |
| 2009 | 40% | 34% | 21% |
| 2010 | 41% | 32% | 21% |
| 2011 | 36% | 35% | 23% |
| 2012 | 39% | 35% | 22% |
| 2013 | 36% | 35% | 23% |
| 2014 | 41% | 31% | 23% |


-610x915.jpg)